

There are two regions within the West Coast, (1) the northern portion and (2) the southern portion. How these regions are made and how we define the 14-day extreme precipitation periods can be found here.
Key information:
- There were a total of 40 periods in Northern West Coast and 40 periods in the Southern West Coast from 1915 to 2018.
- The typical wet season for the West Coast occurs from November to March.
- West Coast extreme precipitation periods happen throughout the year, with the maximum number of periods occurring within Spring (MAM).
- Typical storm reports during West Coast periods include heavy snow, heavy rain, flood and high wind.
When do West Cost Extreme Periods occur?
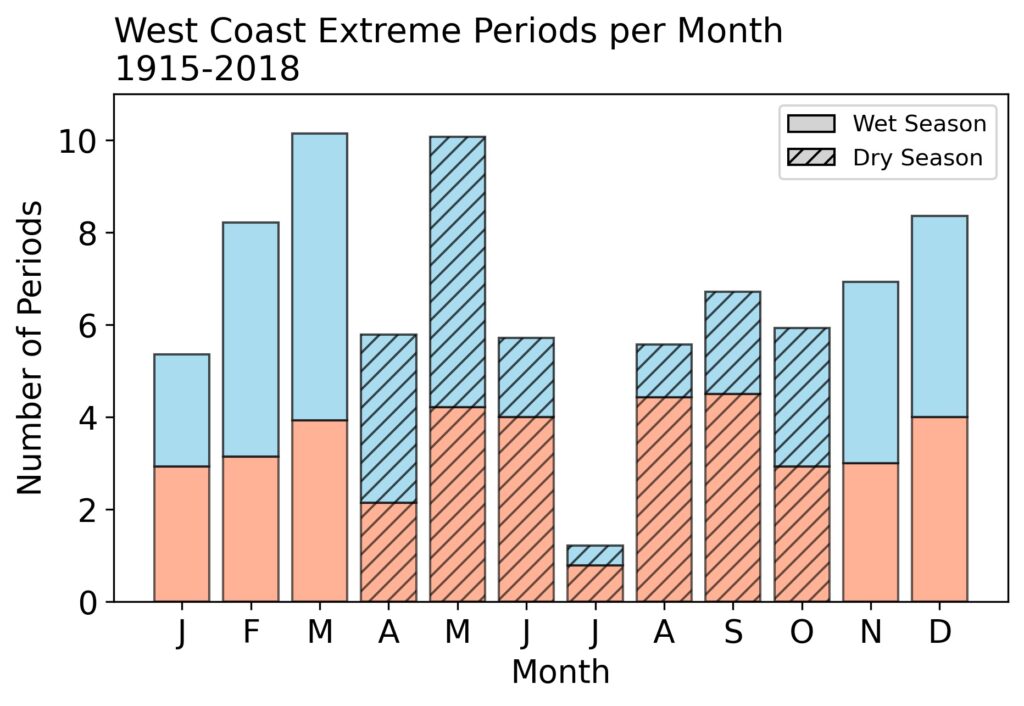
Seen to the left, 14-Day periods within both West Coast regions are counted, based on month, from 1915 to 2018.
The typical wet season within the West Coast occurs from November to March. Yet, 14-day extreme precipitation periods can happen throughout the year. There is a minimum during the month of July, with less than 2 extreme periods throughout the time period of 1915-2018.
What are typical storm reports of West Coast Extreme Periods?

Using NCEI storm reports typical impacts of our 14-day extreme periods, past 1996, can be estimated. Beginning in 1996, 48 event types were recorded into the storm events database. Every report was recorded based on the county of occurrence by a National Weather Service forecast office (WFO) and then passed onto NCEI. Therefore, reports within 14-day extreme periods from 1996-2018 within California, Washington, or Oregon are counted as West Coast 14-day extreme periods reports. Definitions of all storm reports can be found within the NWSI, Appendix A.
The average number of storm reports during a wet season or a dry season extreme period, within both regions in the West Coast, from 1996 to 2018 are seen to the right. “High Wind”, “Flood” and “Heavy Snow” are the most frequent reports seen during periods.
Wet season 14-day extreme periods have larger averages of storm reports for a period compared to dry season events. However, similar storm reports are seen in both wet and dry season periods. Common reports during a wet season period are “High Wind”, average of 61, “Flood”, average of 36, and “Heavy Snow”, average of 26. Common reports during a dry season period are “High Wind”, average of 8, “Flood”, average of 4, and “Heavy Rain”, average of 5.5.
Point of contact: Melanie Schroers, maschroers@ou.edu